steam-runtime-system-info high CPU usage, sometimes hangs
Detected the same problem since the last update. I'm in Ubuntu 16.04.
Side note: if I kill all steamwebhelper process, the cpu usage gets normalized.
Happens on Fedora as well. 100% CPU usage from steam process around 15 seconds after Steam Client is started and lasts until the Steam Client is closed.
I never had this problem before, but ever since the civ6 launcher changes I'm having steam stick at 100% cpu if I leave it running...or if i leave computer idle too long.
Running Ubuntu 18.10
Is there any update on this? I can't leave a game for 5 minutes without coming back to find steam has lost its mind or is mining bitcoins or something nuts.
Today its worse. Steam goes to 100% while I'm actively playing a game..not in idle state. What is going on with this?
I have the same problem on Ubuntu 18.10. 100% on one core. Steam in tray won't quit, I have to kill the process. Then cpu usage normalizes.
I have the same problem on Mint 18.1. As with someone above, I found about 6 steamwebhelper processes, and CPU usage went back down after I ended them.
I think this is the first time I've had this issue; I've used Steam on this OS before recently without issues. Possibly there's been a recent update and this is the first time it's tried to download a game, but I don't know for sure.
Edit: Doesn't seem to be (just?) because of downloads; I slept and then unslept my computer and had the same problem (many steamwebhelper processes; killing them restored CPU usage.)
Same problem here, ubuntu 18.04
The only thing that I can think of is that there is a drawing thread for bigpicture or event thread for the tray icon that does not have a Thread.sleep(milliseconds);
Good sign somebody doesn't know how threading works. At least they didn't mess up and have it infinite-looping on all CPUs. This bug has been around for forever, luckily common CPUs now have more than 2 threads.
However, I have two steam threads pulling 100%, so I am losing 200% cpu power.
Ubuntu 18.04

I saw a fix come through in a recent patch that mentioned something about making idle updates less cpu intensive. Ever since then I've not had the problem again.
Side note for your screenshot @EterniaLogic, htop accounts for the cpu usage by child threads, and the 101% thread is because it's the parent thread and including the 99.2% just below it. Use htop's tree view for this to be clearer.
The system being shown is using 1 core worth for Steam, and 1 core worth for dpkg-deb.
@kisak-valve I've encountered this problem when running Borderlands 2 through Proton. When you exit Borderlands 2, Steam goes to 100%:
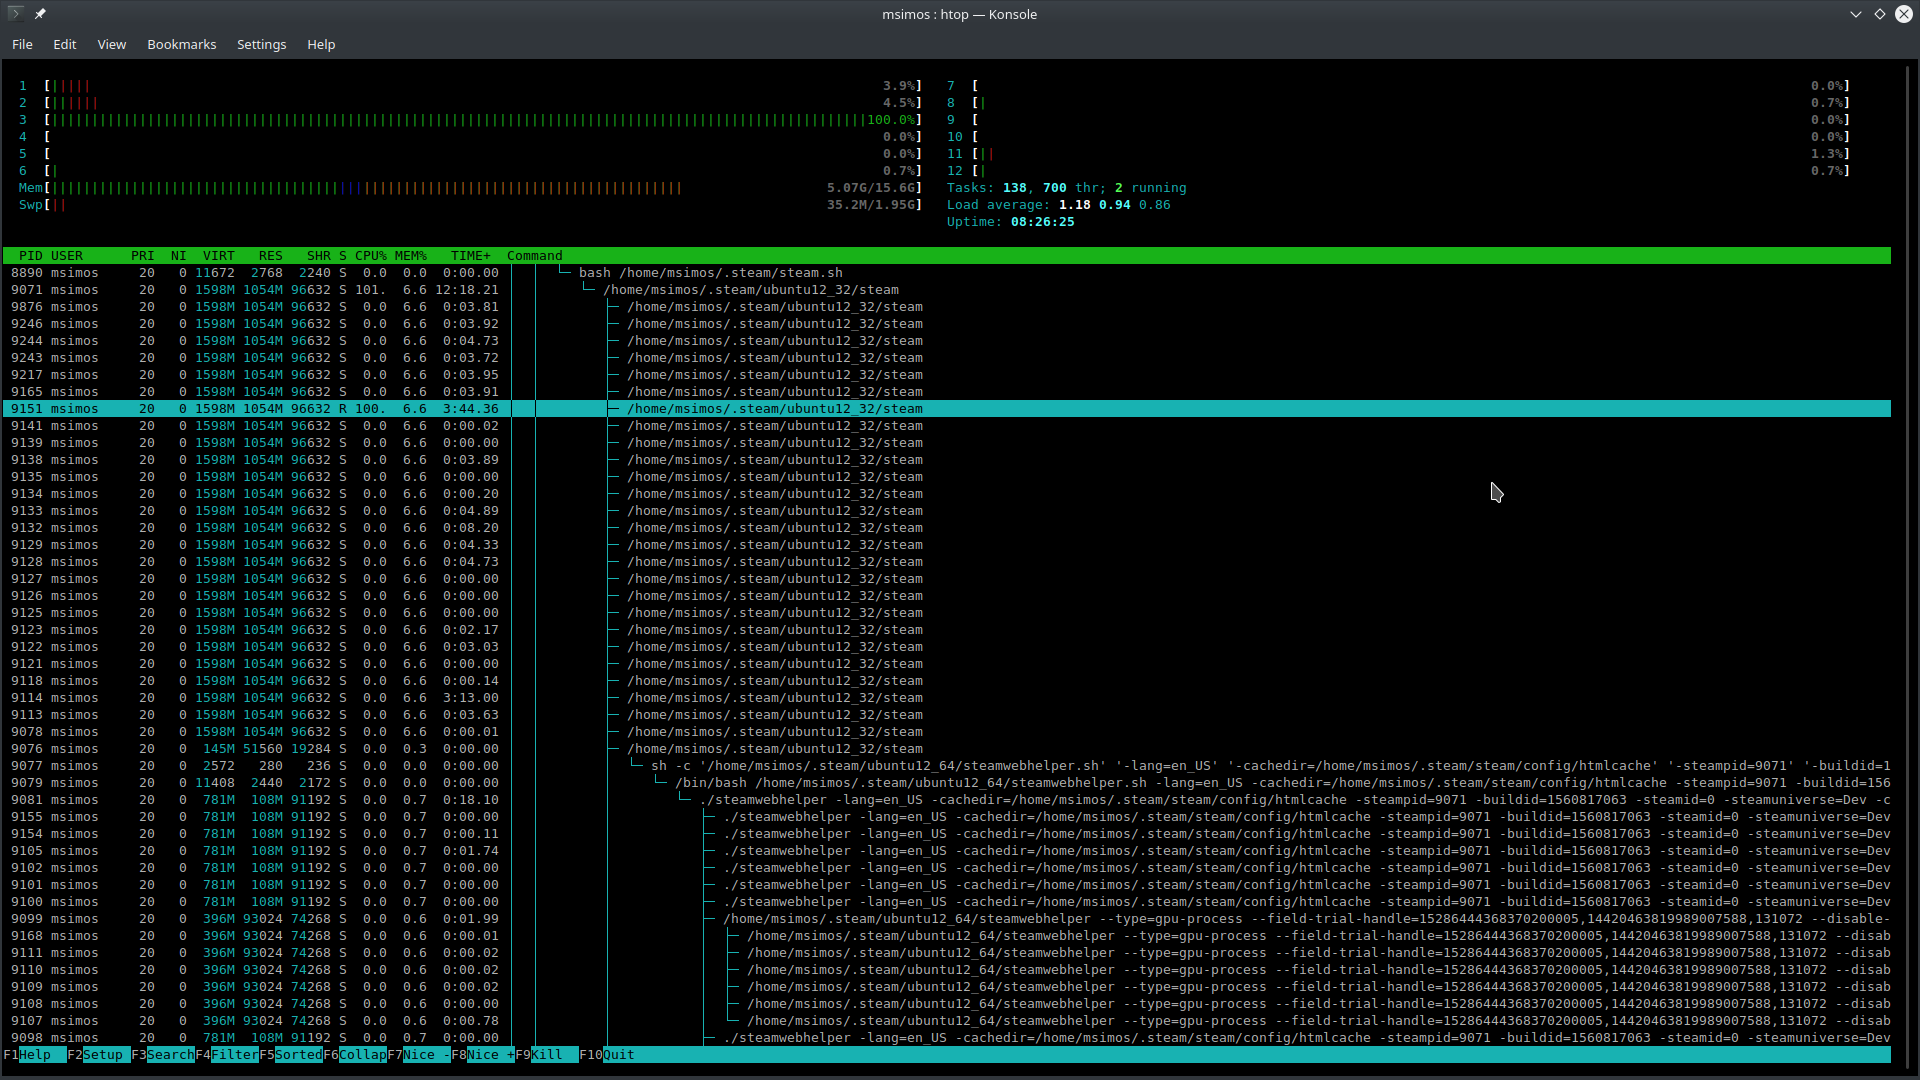
From the attached screenshot thread 9151 is causing the issue. And from ps, we see that thread 9151 is CJobMgr::m_Work.
msimos@msi-gs65:~$ ps -T -p 9071
PID SPID TTY TIME CMD
9071 9071 ? 00:03:37 steam
9071 9072 ? 00:00:00 SteamUpdater
9071 9073 ? 00:00:03 CHTTPClientThre
9071 9078 ? 00:00:00 HTMLController
9071 9113 ? 00:00:03 IOCP Thread 0
9071 9114 ? 00:03:13 CIPCServer::Thr
9071 9118 ? 00:00:00 CFileWriterThre
9071 9121 ? 00:00:00 Controller Work
9071 9122 ? 00:00:03 CSteamControlle
9071 9123 ? 00:00:02 CIPCServer::Thr
9071 9125 ? 00:00:00 CIPCServer::Thr
9071 9126 ? 00:00:00 CIPCServer::Thr
9071 9127 ? 00:00:00 threaded-ml
9071 9128 ? 00:00:04 CJobMgr::m_Work
9071 9129 ? 00:00:04 CJobMgr::m_Work
9071 9132 ? 00:00:08 CHTTPClientThre
9071 9133 ? 00:00:04 CIPCServer::Thr
9071 9134 ? 00:00:00 SocketThread
9071 9135 ? 00:00:00 CSteamControlle
9071 9138 ? 00:00:03 CHTTPCacheFileT
9071 9139 ? 00:00:00 gmain
9071 9141 ? 00:00:00 gdbus
9071 9151 ? 00:04:04 CJobMgr::m_Work <--- here
9071 9165 ? 00:00:03 CHTTPClientThre
9071 9217 ? 00:00:03 CHTTPClientThre
9071 9243 ? 00:00:03 CNet Encrypt:0
9071 9244 ? 00:00:04 steam
9071 9246 ? 00:00:03 CNet Encrypt:0
9071 9876 ? 00:00:03 CHTTPClientThre
9071 2324 ? 00:00:00 CFileWriterThre
9071 2594 ? 00:00:00 CHTTPClientThre
I can confirm @msimos findings about CJobMgr::m_Work. I've seen it more than once hogging the CPU indefinitely after finishing a game. The only solution is to restart Steam.
I'm getting the same issue, but it's only when a download is running. The download stalls and won't complete.
Still an issue. Running steam 1.0.0.61-3 on Arch Linux.
After latest beta update it got worse. For me at least.
https://steamcommunity.com/groups/SteamClientBeta/announcements/detail/1698351414165876179
After mentioned update , now client always keeps one thread busy ;sometimes busy thread is changing. When i look at running processes i see i386-linux-gnu- as a zombie process , a timeout process with this: libasound2.so that comes from runtime again ; CjobMgr::m_work process and last of all this one:

After closing Steam client those three processes stays there:

Thanks @Leopard1907, can you provide the output on the Help > System Information dialog?
Sure , here.
https://gist.github.com/Leopard1907/15c6e47dfa025df455ae9c3ad63decef
It says " report not available yet" about runtime stuff , normally.
Btw , looks like this always changes between every client restart.

Now it is gstreamer.
Thanks, that makes sense. So if you run the following:
~/.steam/steam/ubuntu12_32/steam-runtime/run.sh ~/.steam/steam/ubuntu12_32/steam-runtime/amd64/usr/bin/steam-runtime-system-info
You should be getting the same problem - the process or one of it's children will hang.
Or maybe it just takes a very long time on your system for some reason? (15-20 seconds would be "normal").
You can disable this check by moving ~/.steam/steam/ubuntu12_32/steam-runtime/amd64/usr/bin/steam-runtime-system-info out of the way for now, it won't really hurt anything.
In order to trace what it might be getting stuck on, can you do:
strace -ff -o srt ~/.steam/steam/ubuntu12_32/steam-runtime/run.sh ~/.steam/steam/ubuntu12_32/steam-runtime/amd64/usr/bin/steam-runtime-system-info
And zip up all the srt.* files that'll come out of it. Since in your case it's hanging you might want to wait about 30 seconds before killing it.
It was 15-20 seconds just before latest client update but this one made it permanent. ( cpu issue )
With ~/.steam/steam/ubuntu12_32/steam-runtime/run.sh ~/.steam/steam/ubuntu12_32/steam-runtime/amd64/usr/bin/steam-runtime-system-info i'm able to get runtime info. Client off and on situations. Running it when client works doesn't solve this problem ( still pegs cpu ) , when client is off ofc it doesn't spawn such processes.
I did strace stuff and it didn't hang.
Here are the outputs:
Do you have the 'Steam Linux Runtime' installed at all? (e.g. the container runtime)
If you do, what happens if you uninstall it, or disable it by renaming it before starting Steam?
Do you still get a hanged process?
If you do have it installed, is it actually this command that is causing a hang:
~/.steam/steam/SteamApps/common/SteamLinuxRuntime/run-in-scout -- steam-runtime-system-info ?
Yes, i am using Steam Runtime from compat tools on a native game.
I'm not at home rn but i will ping you when i try what you've suggested.
FWIW I have the same issues as mentioned above by Leopard, issues that started to manifest after the latest beta update.
Before the update (or switching back to stable) there was an aprox 30 secs high CPU usage that eventually would go away. After the update the CPU hang is permanent and I see the same zombie processes after closing Steam.
However I do not have the 'Steam Linux Runtime' installed and moving away the "steam-runtime-system-info" does indeed solve the CPU hang.
Htop reports the "IOCP Thread 0" as the process that hangs.
Running the "steam-runtime-system-info" by itself doesn't hang the CPU and the output is instant.
@dubigrasu sounds good, please see my earlier comment https://github.com/ValveSoftware/steam-for-linux/issues/5493#issuecomment-564795250 and check if you can reproduce the hang and capture it?
Ah, forgot to mention that I tried running through the steam runtime, but couldn't reproduce the hang.
Basically I did: LD_LIBRARY_PATH=~/.steam/bin32/ ~/.steam/bin32/steam-runtime/run.sh ./steam-runtime-system-info and it worked instantly.
In any case here's the trace result as instructed above (as mentioned, it did not hang):
strace.zip
@dubigrasu - ok, I'm assuming there is no hang without using LD_LIBRARY_PATH either? (why do you set it in the first place - shouldn't be needed?)
With or without LD_LIBRARY_PATH it still doesn't hang.
Setting the LD_LIBRARY_PATH was recommended by a Valve dev to be used when running something through the steam runtime.
Thanks for clarifying - as long as you use run.sh you don't need to specify anything else.
I don't get hangs with : ~/.steam/steam/steamapps/common/SteamLinuxRuntime/run-in-scout -- steam-runtime-system-info
Output of it is like that:
https://gist.github.com/Leopard1907/fa2f3252f013a779b0c42f765de53d7a
@dubigrasu are you on Arch as well?
No, Ubuntu 18.04.3 LTS:
https://pastebin.com/raw/Fm0DH4Vx
Just an update: I rolled back to stable client and it seems a similar zombie process stuff is also on there but with a difference.
Stable client survives through them after a while , i386 , x86_64 etc it goes like that. And works fine , no more pegs cpu.
On beta ; it can't get past i386-linux-gnu- process.
Same problem on Ubuntu 18.04. Renaming ~/.steam/ubuntu12_32/steam-runtime/amd64/usr/bin/steam-runtime-system-info fixes it.
For what it's worth, having the same issue on ubuntu 18.04.3 steam client: steam-runtime_0.20191210.1 is loading 1 core 100% constantly.
I can confirm that renaming steam-runtime-system-info as suggested removes the constant CPU load.
I think i don't have this problem, i had seen link to this issue in discord.
Command ~/.steam/steam/ubuntu12_32/steam-runtime/run.sh ~/.steam/steam/ubuntu12_32/steam-runtime/amd64/usr/bin/steam-runtime-system-info works almost instantly and prints some json, but my user interface starts lagging, mouse twitches until command executed.
Yes, running this from the command line worked for me too (less than a second delay), but as soon as I started the steam UI, one of the CPU cores was sitting at 100% and games were twitchy.
With the file above renamed, the UI doesn't hog a core and games run normally.
Same happens to me.
https://gist.github.com/NoXPhasma/71109fecedd75e258b976eb3c77999e5
If you experience the problem of steam-runtime-system-info never terminating, please consider doing the following to help us with diagnosis:
-
Check that this only happens when this check is started by Steam, and that running
~/.steam/steam/ubuntu12_32/steam-runtime/run.sh ~/.steam/steam/ubuntu12_32/steam-runtime/amd64/usr/bin/steam-runtime-system-infoterminates correctly. -
Replace
~/.steam/steam/ubuntu12_32/steam-runtime/amd64/usr/bin/steam-runtime-system-infoby a wrapper script to invokesteam-runtime-system-infowrapped in something likestrace -ff -o srtetc. -
You can also attach with gdb and obtain backtraces of which processes are stuck.
If you want to dig deeper, the source to steam-runtime-system-info is available and released under an open source license, see http://repo.steampowered.com/steamrt-images-scout/snapshots/0.20191210.1/
I think the problem that popped up in the last few days is a separate problem. I never had any of the issues discussed earlier in this thread (stuff from before this comment), but I'm having the 100% CPU usage that started in the last few days.
It might be best to split this off into another issue.
Here is what we are tracking in this report:
-
We are going to move
steam-runtime-system-infoto execute on demand rather than at startup in an upcoming update to the Steam client. This will resolve concerns of high CPU usage at startup, or at least anything that may have been caused by the tool. -
The
steam-runtime-system-infoappears to hang on some systems. We would like to identify causes and fix if possible. It's a secondary priority since we are moving the tool away from always being executed.
We do not plan to track any other problems here. Activity before @Leopard1907 started posting information is either outdated or generally unrelated to steam-runtime-system-info - if these issues still happen after the changes we are planning to make for steam-runtime-system-info, please open new issues.
Fwiw i've asked other users too and by looking at activity in this report last few days ; issue seems to be specific to distros with Ubuntu 18.04 base.
@Leopard1907 That seems to line up with my case as well. I'm on KDE Neon, which is based on Ubuntu 18.04. The real question, however, is if anyone who's on 18.10 or newer is having the same issue.
@TTimo ironically, at least in my case, the 100% CPU usage is gone for the first several seconds of Steam's GUI running. A few times I thought it had fixed itself because I'd go to a few different views (library, store, community, etc.) and it wouldn't come back... Until about 25 - 30 seconds after the Steam GUI appears (I've timed it). At that point, the 100% CPU usage kicks in - but before that everything is fine.
The issue appeared on my system 2 days ago, I'm on Ubuntu 18.04. The CPU usage is 100% when CJobMgr::m_Work loads. Restarts did't work, Disabling Shader pre-chaching didn't work either, I opted out of beta and the issue was still present. It disappeared once when the new driver updates were installed but after a reboot the issue was back again. Renaming ~/.steam/ubuntu12_32/steam-runtime/amd64/usr/bin/steam-runtime-system-info fixed the problem.
Same problem noticed here, Linux Mint 19.2, one thread used 100% of the time.
Solved it by turning off Remote Play in settings. Hope that will fix that issue for you as well, using Dec 12 compilation, API: v020, steam packet 1576196354
I am on Mint 19.2 (based on Ubuntu 18.04) and started getting this problem a few days ago.
Renaming ~/.steam/ubuntu12_32/steam-runtime/amd64/usr/bin/steam-runtime-system-info fixed the problem.
Check that this only happens when this check is started by Steam, and that running ~/.steam/steam/ubuntu12_32/steam-runtime/run.sh ~/.steam/steam/ubuntu12_32/steam-runtime/amd64/usr/bin/steam-runtime-system-info terminates correctly.
Correct.
Replace ~/.steam/steam/ubuntu12_32/steam-runtime/amd64/usr/bin/steam-runtime-system-info by a wrapper script to invoke steam-runtime-system-info wrapped in something like strace -ff -o srt etc.
This also fixes it - I can confirm that the renamed steam-runtime-system-info.disabled is being called by the shell script named steam-runtime-system-info, and it terminates after a few seconds. This occurs about 5 seconds after I start steam.
Same problem on Ubuntu 18.04. Renaming ~/.steam/ubuntu12_32/steam-runtime/amd64/usr/bin/steam-runtime-system-info fixes it.
Same.
I was getting one core running at 100%, even after exiting steam. Manifested in BFBC2 as smooth mouse motion always being jerky, and GPU (or maybe CPU) fan still thrashing at 100% even after game exit.
Seems to have been fixed with:
mv ~/.steam/ubuntu12_32/steam-runtime/amd64/usr/bin/steam-runtime-system-info  \
~/.steam/ubuntu12_32/steam-runtime/amd64/usr/bin/NOT_steam-runtime-system-info
[edit]
Correction. It seems to stop steam from using all of one core, but after a few minutes play my mouse movement is choppy again.
Correction. It seems to stop steam from using all of one core, but after a few minutes play my mouse movement is choppy again.
This is most probably an issue with Proton 4.11-10 and not related to this. You can revert to 4.11-9.
This is most probably an issue with Proton 4.11-10 and not related to this. You can revert to 4.11-9.
Thanks.
[edit] removing the dumb and the tl;dr
Proton updates itself, yes.
Tried stracing steam-runtime-system-info, but this stops it using 100% of a core. Anyway, even with steam-runtime-system-info renamed, the mouse twitchiness is back. Seems to pause for a fraction of second every 2 seconds like clockwork.
It is a bit weird that is also being pushed to stable client in this state right now.
srt-info is disabled in stable for now, the change briefly missed the shipping boat but we caught it.
Yup , reverted in both stable and beta now.
https://steamcommunity.com/groups/SteamClientBeta/announcements/detail/3149636493213321751
I was able to reproduce this easily on Linux Mint 19.2 (as a virtual machine with no passthrough card; this i7-920 setup has no iommu).
I have not yet seen this on Fedora 31 and could not reproduce it on Fedora or Mint the other day before the updates disabled it (nor after) using either of the below commands (did not try them today, though). Nor was I able to reproduce it by using steam runtime with an xterm launched as a game and running the command. There may be specific environmental/state conditions or race in how it's run or it's status is checked while running? (Un)fortunately Mint 19.3 just released the other day (I've not tested it yet).
$ ~/.steam/steam/steamapps/common/SteamLinuxRuntime/run-in-scout --steam-runtime-system-info
$ ~/.steam/ubuntu12_32/steam-runtime/run.sh .steam/ubuntu12_32/steam-runtime/amd64/usr/bin/steam-runtime-system-info
I was curious enough to test with Mint as I thought might help (I know Fedora troubleshooting very well, most of the lower level stuff will apply to debian, but will need to get familiar with acquiring their debug symbols, etc; if it comes to it).
To reproduce it with Mint 19.2 (loosely noted from memory for now)
- Download Mint 19.2 Cinnamon version (not 19.3 unless you want to test that)
- Install as a VM (used plain virt-manager/kvm)
- Choose to enable 'extra/non-free' repositories. (may not be needed)
- Update the system (not sure if it's release locked to 19.2 w/ 19.3 out now, I think yes? may not be needed)
- Go to the main menu (or press Window/Super key)
- In search box type "Update" and then run "Update Manager" and do the updates available
- (Did I mention I'm not a Mint/Debian user... otherwise I'd have specific cli commands for you)
- Also installed a few packages via apt-get (likely not needed to reproduce? And others not listed.)
$ sudo apt-get install libvulkan1 libvulkan1:i386 mesa-vulkan-drivers mesa-vulkan-drivers:i386- (Remember I did not have a passthrough card so no vulkan support really.)
- Oh, also install
steamfrom the repos as well...$ sudo apt-get install steam
For me, above resulted in this dpkg -l_ list (pastebin.com :| )
- Run steam, login, and let it do all of it's updates to date of this posting.
- Launch the updated steam and run from menu:
- "Help" -> "System Information"
- (it should now start generating the later report at the bottom saying waiting...)
- Observe high cpu usage in
htop(installed it?)
Actual results in Mint for above test:
EDIT: WARNING, my strace wrapper had sudo strace... likely any LD_* were stripped by sudo per my newer comment. So the part about strace changing the behavior below may not be fully valid. (also see newer comment after reading the below)
- High cpu usage seen for a
steamprocess.- strace of said process shows a lot of polling (did not have time to check the socket/fd)
- ltrace shows lots of
clock_gettime()and someusleep(0)withwaitpid()prior; patterns - Note that these threads I scrolled through real fast and may not be directly related. Did not have
perf/gdb/debuginfo installed yet.
- Very slow to finish checks of shared libraries.....
- Each of these checks takes the full 10 seconds...
steamer 4374 0.0 0.0 11740 352 pts/1 S 04:32 0:00 timeout --signal=TERM --kill-after=3 10 /home/steamer/.steam/ubuntu12_32/steam-runtime/amd64/usr/bin/../libexec/steam-runtime-tools-0/i386-linux-gnu-inspect-library --deb-symbols libpango-1.0.so.0 /home/steamer/.steam/ubuntu12_32/steam-runtime/usr/lib/steamrt/expectations/i386-linux-gnu/libpango1.0-0.symbols steamer 4375 0.0 0.0 0 0 pts/1 Z 04:32 0:00 [i386-linux-gnu-] <defunct> - If
timeoutis wrapped with asudo strace ...(and replaced while it's still actively going through libraries) the behavior subsides, all exit quickly and high cpu drops. I did not take time to see if the json output was correct for the system or not yet. - The
timeoutstrace runs calls like below and indeed that particular lib is not on the system:10818 04:52:43 execve("/home/steamer/.steam/ubuntu12_32/steamruntime/amd64/usr/bin/../libexec/steam-runtime-tools-0/x86_64-linux-gnu-inspect-library", ["/home/steamer/.steam/ubuntu12_32/steam-runtime/amd64/usr/bin/../libexec/steam-runtime-tools-0/x86_64-linux-gnu-inspect-library", "--deb-symbols", "libgstnet-0.10.so.0", "/home/steamer/.steam/ubuntu12_32/steam-runtime/usr/lib/steamrt/expectations/x86_64-linux-gnu/libgstreamer0.10-0.symbols"], ... .... 10818 04:52:43 write(2<pipe:[293406]>, "Unable to find the library: libgstnet-0.10.so.0: cannot open shared object file: No such file or directory\n", 107) = 107 <0.000026> 10818 04:52:43 write(1<pipe:[293405]>, "{\n \"libgstnet-0.10.so.0\": {\n}\n", 31) = 31 <0.000013> 10818 04:52:43 exit_group(1) ``` - EDIT: Wait.. actually it is here in a place on debian (I'll need to double check the places it stat'd later)
$ find /lib* /usr/lib* -name '*libgstnet*' /usr/lib/x86_64-linux-gnu/libgstnet-1.0.so.0.1405.0 /usr/lib/x86_64-linux-gnu/libgstnet-1.0.so.0 /usr/lib/x86_64-linux-gnu/gstreamer-1.0/libgstnetsim.so ``` - Again, the above when traced did not take the 10 seconds (or it got past the delayed ones and started running fast by chance at that time.
ptraceleading to the behavior not being seen matches what the other user here mentioned, though. Trace was via wrapper so probably at least no EINTR errno from a sudden -p attach shaking it up after it started. - Did not check all processes in the tree closely, but in general the parents of the slow checks look like:
| | |-bash(1683)---steam(1691)---bash(1693)---steam(2788)-+-CJobMgr::m_Work(3008)---sh(3009)---steam-runtime-s(3010)---timeout(3717)---i386-linux-gnu-(3718) - Nothing looked to be in D state for any observable amount of time so I did not check
/proc/<pid>/stackand such. - In all my PAST tests when it did not reproduce the other day it only took total of 20-30 seconds or less after the first run; so did not see the 10 second waits on each library checks until the test after the most recent update.
- Each of these checks takes the full 10 seconds...
So the high cpu usage might indeed be a tight polling loop or something else, but I did not have the time to check into the details further this morning.
For now...
I will likely return or do some more testing on this in the next few days. I may also try 19.3 and check bugzillas for any particular issues (I doubt it is related to timeout itself), look over the sharedlibraries and github to get a better idea of what it's trying to do, but I hope this might help so that someone familiar with the code might also be able to reproduce the issue as well. It would/will take me a bit of time to figure out adding all the debuginfo and non-stripped runtime binaries for later troubleshooting on debian, though.
For Fedora users
If a Fedora user is able to reproduce this exact issue of a long running system-info with high cpu usage seen, then please collect the following to give me a chance of matching the environment to reproduce the issue. -- Preferably run it all as root in the same terminal and in order using script as seen below, or just dump them to files if preferred. Note that script will log only the screen output (so sudo password input etc won't be there if using sudo).
# script /tmp/steam-details-fedora-$(hostname -s).log
# rpm --qf '%{name}-%{version}-%{release}.%{arch}\t%{installtime:date}\n'
# dnf repolist -v
# uname -a
# cat /etc/os-release
# rpm -Va
# exit
(Note that `rpm -Va` takes quite a while to complete usually as it verifies all rpm installed file states; It is not critical to collect but may help with knowing what configuration changes or clobbered libs might be relevant.)
The /tmp/steam-details-fedora-.log can then be provided online. It may have some binary/term related characters due to script.
All I really need at a minimum is likely the rpm+dnf output so I can match the rpms on a test system. The repo details can help track them down for third-party ones; though fedora pulls older packages so I'll have to pull them from koji/etc manually if they are not the latest versions :(
Sorry, I wasn't able to get to fully checking out the trace patterns and more details upfront but wanted to post this sooner than later for others/confirmation.
As another quick note I forgot to mention -
- My test is with the latest steam beta version.
- Running it manually from a normal terminal (likely after this specific command has been run by steam, if that matters for this process) does NOT cause it to wait a full 10 seconds. (also the straces from the wrapped time... oh oops dang..... I forgot I wrapped it with
sudo stracewhich issetuidandLD_LIBRARY_PATHetc would be stripped. I just realized while I was about to say i did not see any special extra paths passed in the strace output which i did not expect... argh. Sorry.... I fought with debian and yama and gave into just making sudo run with no password to quick get the check in. So part of my wrapper test in the previous comment (specifically the strace of individual timeout) may be invalid... Either way, for now, note non-wrapped timeout output does not wait the 10 seconds if run directly from the command line, no special library paths set:
$ timeout --signal=TERM --kill-after=3 10 /home/steamer/.steam/ubuntu12_32/steam-runtime/amd64/usr/bin/../libexec/steam-runtime-tools-0/i386-linux-gnu-inspect-library --deb-symbols libXt.so.6 /home/steamer/.steam/ubuntu12_32/steam-runtime/usr/lib/steamrt/expectations/i386-linux-gnu/libxt6.symbols
{
Unable to find the library: libXt.so.6: cannot open shared object file: No such file or directory
  "libXt.so.6": {
}

$ find /usr/lib* -name 'libXt*'
/usr/lib/x86_64-linux-gnu/libXtst.so.6.1.0
/usr/lib/x86_64-linux-gnu/libXt.so.6
/usr/lib/x86_64-linux-gnu/libXt.so.6.0.0
/usr/lib/x86_64-linux-gnu/libXtst.so.6
- Running the Help->System_Information a second time is quick and probably does not run all the checks. Quitting steam fully and then starting it and the system-info check again from the menu can reproduce it again.
Apparently in my sleepy state my 'echo 0' did not reach the yama... with that fixed -
- Indeed with
timeoutwrapped in bash correctly with strace everything completes quickly (no 10 second wait) and LD_LIBRARY_PATH etc are seen in the initial execve() (<- sanity check).
LAST EDIT: There are actually a few old upstream debian bugs about timeout... I did not yet check all of them in detail; however, doing something silly and >>> moving a Fedora 30 timeout binary over to the Mint system, seems to have WORKED without issue.... <<< (several tests w/ restarted steam, all worked) Moving back the Mint version causes the issue to return. I can't say that it is a timeout specific issue, or if this is consistent (as compared to it being very consistent if not always that the issue is reproduced on the first start of steam and run of the system-info) but that may be something to consider. If there are any newer Mint versions of coreutils in the 19.3 Mint release from yesterday, may be worth trying or exploring. Exit status of 124 at least for timeout is that it timed out (since --preserve-status is not set), so expected status in these long running scenarios.
I wonder if timeout usage was added /changed somewhat recently (correlation with issues) or just others noticing some change. Is it worth testing with lower versions of it or it's supporting libs etc, if it was indeed related; as an attempt to narrow down if it's a usage issue or bug within the OS side, etc? (All my package fu is in fedora/rpm so not as quick to downgrade upgrade and do various tests at the moment on debian/mint).
Lastly, note again that the cpu usage may be a side effect of the delays, but due some misbehaving code/looping elsewhere as I think one other user had noted as a possibility previously. I could try sleeping for 10 seconds without using timeout for each library check to see if that causes the same behavior (regarding that side).
(I'll need to return later and test that part again and do a bit more poking. Maybe see if I can add debug details to moving parts or observe without affecting outcome.)
And I forgot - best to note the versions of coreutils (changelog is fedora's I haven't checked debian's)
The Mint 19.2 reproducing the issue has:
- coreutils is at  8.28.1ubuntu1 amd64


[fedora]$ rpm -qa coreutils
coreutils-8.31-6.fc31.x86_64

/usr/share/doc/coreutils-common/NEWS
----------------------------------
 ....

Noteworthy changes in release 8.29 (2017-12-27) [stable]

** Bug fixes
   ....
  timeout will again notice its managed command exiting, even when
  invoked with blocked CHLD signal, or in a narrow window where
  this CHLD signal from the exiting child was missed.  In each case
  timeout would have then waited for the time limit to expire.
  [bug introduced in coreutils-8.27]

....

* Noteworthy changes in release 8.21 (2013-02-14) [stable]
  ....
** New features
  ....
  timeout now accepts the --preserve-status option to always propagate the exit
  status, useful for commands that can run for an indeterminate amount of time.

** Bug fixes
  ....
  timeout now ensures that blocking of ALRM signals is not inherited from
  its parent, which would cause timeouts to be ignored.
  [the bug dates back to the initial implementation]

....

* Noteworthy changes in release 8.2 (2009-12-11) [stable]

** Bug fixes
  ....
  timeout is now immune to the signal handling of its parent.
  Specifically timeout now doesn't exit with an error message
  if its parent ignores CHLD signals. [bug introduced in coreutils-7.6]
@Leopard1907 it may be worth testing again now to see if you see the issue by exiting and starting steam and then using the "Help" -> "System Information" menu item; just to be sure you also still see the behavior with the latest version of beta Built: Dec 19 2019, at 00:33:07; API v020; Steam package ver: 1576717541
Thanks! We've been able to reproduce on Ubuntu 18.
Now that srt-info has moved to be triggered only when the System Information dialog is brought up, there should not be any high cpu usage problems at startup anymore.
timeout may be the cause of the problem. On my test system I do not observe the Steam thread doing a busy polling though. But I see all the inspect-library processes dying under timeout.
Now that
srt-infohas moved to be triggered only when the System Information dialog is brought up, there should not be any high cpu usage problems at startup anymore.
Yes, sorry it took a bit before I clarified that in my edits. Indeed it doesn't happen just on start. Glad you can reproduce it!
I keep looking back at this but actually need to moving for day job :)
Though I checked this real quick - when using the Mint version of timeout, for the waiting timeout process scenario - I do see parent and timeout both with SIGCHLD blocked if I've done the conversion correctly:
$ grep Sig *.status
steam-runtime-system-info.status:SigQ:	4/7713
steam-runtime-system-info.status:SigPnd:	0000000000000000
steam-runtime-system-info.status:SigBlk:	0000000000010000
steam-runtime-system-info.status:SigIgn:	0000000000003010
steam-runtime-system-info.status:SigCgt:	0000000180000000
timeout.status:SigQ:	4/7713
timeout.status:SigPnd:	0000000000000000
timeout.status:SigBlk:	0000000000010000
timeout.status:SigIgn:	0000000000300010
timeout.status:SigCgt:	0000000180016007
Some links with debian/upstream changelog that may be useful latter for checking on ubuntu/mint timeout. Not necessarily your role to do but going to save them for reference. I believe Mint is based ooff Ubuntu LTS 18.04.
https://packages.ubuntu.com/bionic/coreutils
https://savannah.gnu.org/forum/forum.php?forum_id=9039
Savannah Git Hosting - changes around v0.29
Savannah Git Hosting - coreutils.git - timeout: fix a small race that would ignore command exit
Savannah Git Hosting - coreutils.git - timeout: fix regression when invoked with blocked SIGCHLD
If a backport test of that patch for Ubuntu/Mint helps then way may be able to say that that is the cause; else maybe by avoiding the blocked signal on the parent. I tried building a debian package on fedora once to fix a fast cgi issue temporarily for a friend; may be able to backport the fix for that if it's not there just for the sake of testing if that is related. Or at least check the available versions in debian for affected/patched.
timeout may be the cause of the problem. On my test system I do not observe the Steam thread doing a busy polling though. But I see all the inspect-library processes dying under timeout.
In the next day or two I'll see if I can sort out specifically what and how the high cpu usage looks. May be a bit harder if there isn't debuginfo for the processes (if not the runtime side) but maybe I can clarify a bit more of what it looks like on my side.
@TTimo Yes, it's gone on Steam launch, but now this happens when System Informations are asked. It creates the same behaviour as we've had initially: 100% load on one thread but ends after 10-15 seconds. However the steam-runtime-system-info process keeps alive.
Also the System Informations ends with The runtime information tool is preparing a report, please wait... (full info).
@TTimo Yes, it's gone on Steam launch, but now this happens when System Informations are asked. It creates the same behaviour as we've had initially: 100% load on one thread but ends after 10-15 seconds. However the steam-runtime-system-info process keeps alive.
In my tests I don't see the high cpu loading immediately after starting "System Information" but maybe 10-20 seconds later (I'll time it next time) then it stays around 100% for that process while the slow process of waiting 10 seconds for every library check. It's also important to note that for me:
- after a fresh start of steam that the issue will occur when you choose "System Information" but if I let it finish (or as I've intercepted with strace wrapper of
timeouta few times, it would complete the remaining checks quickly; and I -think- it cleaned everything up at that point); but for certain after the details are output into the Information dialog, the load then subsides. - running "System Information" a second time without first fully exiting steam will -not- cause the high cpu load again (I don't think it runs the checks a second time). This part may be known/understood but I waned to clarify as that is one reason why I might not see high cpu usage unless I did a clean exit and start of steam.
(most of the time I have been swapping out the timeout binary with the wrapper/fedora-version after I have triggered the problem, which leads to it quickly finishing everything once swapped. so I have not tested to see if after waiting a long time if it finishes on it's own and if those processes stay beyond that point.)
(EDIT-note: I removed a few irrelevant parts of this comment as I mistakenly used the non-beta client in a later quick test just before making this comment to re-verify the state and thought I was no longer able to reproduce the issue due to most recent updates; future additional details will be in a new comment.)
Before the holiday I was able to reproduce the CPU usage issue easily (with intentional sleeps in a wrapper of timeout on Fedora because otherwise it was only an issue on Mint); I was able to reproduce the CPU usage easily though when it started it seemed to be intermittent as to how quick it began or if it triggered (unsure), so I took a break from looking at it for some time over the holiday, with the intention of gathering a bit more information to narrow it down later.
For Fedora (artificially as noted, as Fedora's timeout does not have the bug with the steam parent inherited signal mask) I collected some strace and perf data, though I was missing some steam side symbols. Note that the load issue has never been reproduceable in my test when using external methods like:
Thanks, that makes sense. So if you run the following:
~/.steam/steam/ubuntu12_32/steam-runtime/run.sh ~/.steam/steam/ubuntu12_32/steam-runtime/amd64/usr/bin/steam-runtime-system-info
or
PATH="$(~/.local/share/Steam/ubuntu12_32/steam-runtime/setup.sh --print-bin-path):$PATH" ~/.local/share/Steam/ubuntu12_32/steam-runtime/run.sh steam-runtime-system-info
(and similarly per my past comments - never via a steam game with lauch options to start it)
@TTimo and others: Is there a good way -currently- to test an older Beta client version, or a flag/button to allow the Help -> System Information dialog to purposely run the srt-info in the same way as it has always done; for testing purposes?
EDIT2: It would help if I was not trying the Dec 16th -non-beta build for the new test user. Oops. Still reproduceable with Beta after all it seems. (Shouldn't poke at this late at night after a long day of work.)
Before the holiday I had been writing up a summary of observations but I had restarted this system to demonstrate a separate issue to someone and seem to have lost part of that summary in my sudden reboot. I'll work on writing up something based on the strace and perf data i had collected prior. I was looking for a easily-viewable way to share the raw SVG heatmap of the callgraph and put that off until now.
In short preview for now, the IOCP Thread is the one that shoots up in load and has couple fast-returning oneshot epoll_wait() (with EPOLLHUP when I happened to observe) that hits 100% of a core for the time waiting for all the slow srt-info library checks to complete. No data on any fd, save for a tiny bit of ssl data maybe once, yet lots of busy spinning. Also I can confirm the srt-info does stay running after I exit the client in one of my tests. --- Intercepting the websocket or setting up something like a systemtap script or ld.preload/etc to track file/socket communication between threads to try and understand the behavior of the closed binary did not seem like a productive use of time just before the holiday so I had sat on some of the details until I could decide on summarizing what I had or poking a bit more. (Tracking file descriptors and the details in the epoll event responses by casual observation was not immediately obvious given that this IOCP thread is likely a worker handling multiple ssl/io connections and it was -after- the issue behavior had started. It may be more obvious how it is related to the context in which the System Information dialog is launched for those familiar with the code. I delayed my reply as I had wanted to confirm for certain the high cpu usage was not separate from the srt-info even though it has been only ever and always been triggered by myself in the past by launching the dialog just after logging in (and going to a 'News' or low-activity page in the main client) and not prior to running it even if waiting a while before launching it.)
I'll work on providing some of the perf details in the near future but may be able to clean it up a bit more. --- My current position is that there is still an issue that can be triggered that leads to High load, which happens to be seen in the case where timeout on debian (prior to the aforementioned patch that should fix the timeout issue where it stays running past the full 10+ seconds with it's zombie child that already exited much earlier); ie. while those library checks are overall taking a long time to complete. Possibly the issue is deeper within the IOCP Thead or just how the System Information dialog spawned processes interact with it (assuming they do at least indirectly), a race of sorts, or separate. I'm unsure why the high load was not seen in testing on Ubuntu while the timeout/delay issue was observed; it may be a race condition or some other specific condition, which I wanted to narrow down the reproduction steps.
Hello, per "Fix diagnostic tool helper processes blocking until they time out on Ubuntu 18.04", please opt into Steam's beta client, and retest by going into Steam -> Help -> System Information and checking if the tool finishes gathering the diagnostic information at the bottom of the report in a timely fashion.
The changelog entry made it to the release, but it looks like the fix didn't make it into the release code. I think this will still reproduce until next beta update.
Thanks for the status update. I had taken a quick look but did not notice much of a difference in behavior so was not certain.
@TTimo Is the change for this specific to a workaround/solution for when timeout fails to return (such as avoiding it, different masking, an internal timer of sorts), or was a specific issue found elsewhere? ie. do we expect the changes to directly resolve the cpu usage I'm able to see (and that behavior's root cause may now be understood, even if not reproduceable in testing), or would it be safe to assume it will only avoid the chance (aka extended impact window) of the behavior by not having the timeout / jobs (or system info check as a whole) take as long?
I ask the above, because I suspect it is just regarding the timeout taking a while behavior and that the CPU usage and repeating EPOLLHUP was still not seen prior to the changes? Should I plan to open a separate issue regarding that behavior? If the handling of the library checks via timeout has changed such that I won't be able to reproduce the high cpu usage by making timeout a wrapper script (that sleeps for a while and then runs the original timeout command, then sleeps a bit more and exits), then this is great overall; however, the underlying concern that it may happen again in other areas in the future would suggest it may be worth investigation (assuming I can provide specifics on the reproducer steps, since I'm able to reproduce it easily every time so far with the artificial 'sleep' wrapper). I've noticed that it has not mattered much if the sleep is for 10+2 seconds or 10+20 seconds, or 4 seconds, it just means that the high cpu usage subsides faster as all of the checks complete more quickly.
I have some strace snippets and perf data (select screenshots with symbols from older beta client version) and some flame graphs that are more visual (though svg so if rasterized in order to share easily, they won't be interactive, though that is not critical. I tried to pick out where the behavior first started happening to see why in one case the epoll_wait return with only the single EPOLLHUP may not have at first lead to issues for the threads in question, but in another it then immediately picks up as if not being cleared/handled. The order of the shutdown(), recvmsg(), epoll_wait(), and their later resumption in the strace, along with close() and epoll_ctl() varies as might be expected, including the futex wait between the two threads but I had not specifically determined if there may be any clarity of issue there from the trace alone.
As a quick example of data showing the behavior via strace, it's seeing EPOLLHUP for a set of items, thousands of times a second, only a bit after the system info dialog/process is started:
$ ps -eL | grep -E '1225828|1225866'
1225817 1225828 ?        00:17:41 IOCP Thread 0
1225817 1225866 ?        00:00:04 CIPCServer::Thr

$ sed -ne 's/^\([^ ]\+ ..:..:..\..\).*\(epoll_wait.*\(\[[^]]\+EPOLLHUP[^]]\+\]\)\|\(exec.*system-info\)\).*/\1 \3\4/p' /home/steamer/steam-fulltrace-second.strace | head -n9999 | sort -k2 | uniq -c
      1 1225828 04:01:42.2 [{EPOLLOUT|EPOLLHUP, {u32=1, u64=17028110294167060481}}]
      1 1225828 04:01:42.8 [{EPOLLOUT|EPOLLHUP, {u32=3, u64=17210171999339413507}}]
      1 1225828 04:01:43.2 [{EPOLLERR|EPOLLHUP, {u32=3, u64=8589934595}}]
      1 1225828 04:01:43.4 [{EPOLLOUT|EPOLLHUP, {u32=4, u64=4}}]
      1 1225828 04:01:43.6 [{EPOLLOUT|EPOLLHUP, {u32=3, u64=3}}]
      1 1225828 04:01:43.9 [{EPOLLERR|EPOLLHUP, {u32=4, u64=8589934596}}]
      1 1225828 04:01:43.9 [{EPOLLIN|EPOLLHUP, {u32=4, u64=17084159217947901956}}]
      1 1225828 04:01:48.3 [{EPOLLOUT|EPOLLHUP, {u32=5, u64=23188128999145477}}]
      1 1225828 04:01:48.4 [{EPOLLOUT|EPOLLHUP, {u32=6, u64=17041587609484132358}}]
      1 1225828 04:01:51.0 [{EPOLLOUT|EPOLLHUP, {u32=7, u64=7}}]
      1 1225828 04:01:54.3 [{EPOLLOUT|EPOLLHUP, {u32=8, u64=8}}]
      1 1225828 04:01:54.3 [{EPOLLOUT|EPOLLHUP, {u32=9, u64=9}}]
      1 1225828 04:01:54.4 [{EPOLLOUT|EPOLLHUP, {u32=10, u64=17840395086374895626}}]
      1 1225828 04:02:00.9 [{EPOLLOUT|EPOLLHUP, {u32=11, u64=17465482396060090379}}]
      1 1225828 04:02:01.4 [{EPOLLERR|EPOLLHUP, {u32=11, u64=8589934603}}]
      1 1225828 04:02:02.3 [{EPOLLOUT|EPOLLHUP, {u32=11, u64=17465482396060090379}}]
      1 1225828 04:02:02.3 [{EPOLLOUT|EPOLLHUP, {u32=12, u64=17465482396060090380}}]
      1 1225828 04:02:02.3 [{EPOLLOUT|EPOLLHUP, {u32=13, u64=17465482396060090381}}]
      1 1225836 04:02:02.6 [{EPOLLIN|EPOLLERR|EPOLLHUP, {u32=109, u64=109}}, {EPOLLIN|EPOLLHUP, {u32=108, u64=108}}]
      1 1225870 04:02:02.6 [{EPOLLIN|EPOLLHUP, {u32=74, u64=74}}]
      1 1225828 04:02:03.0 [{EPOLLERR|EPOLLHUP, {u32=11, u64=8589934603}}]
      1 1225828 04:02:03.0 [{EPOLLOUT|EPOLLHUP, {u32=14, u64=17041585513540091918}}]
      1 1225828 04:02:03.0 [{EPOLLOUT|EPOLLHUP, {u32=15, u64=15}}]
      1 1225870 04:02:03.1 [{EPOLLIN|EPOLLERR|EPOLLHUP, {u32=54, u64=54}}]
      1 1225836 04:02:03.1 [{EPOLLIN|EPOLLHUP, {u32=78, u64=78}}, {EPOLLIN|EPOLLERR|EPOLLHUP, {u32=92, u64=92}}, {EPOLLIN, {u32=111, u64=111}}, {EPOLLIN, {u32=65, u64=65}}]
      1 1225870 04:02:03.2 [{EPOLLIN|EPOLLERR|EPOLLHUP, {u32=67, u64=67}}]
      1 1225836 04:02:03.2 [{EPOLLIN|EPOLLHUP, {u32=96, u64=96}}, {EPOLLIN|EPOLLERR|EPOLLHUP, {u32=105, u64=105}}]
      1 1225828 04:02:03.5 [{EPOLLERR|EPOLLHUP, {u32=15, u64=8589934607}}]
      1 1225828 04:02:07.4 [{EPOLLOUT|EPOLLHUP, {u32=13, u64=17210131454848139277}}]
      1 1225828 04:02:12.5 [{EPOLLOUT|EPOLLHUP, {u32=13, u64=34826335025102861}}]
      1 1225828 04:02:13.0 [{EPOLLERR|EPOLLHUP, {u32=13, u64=8589934605}}]
      1 1225828 04:02:21.0 [{EPOLLIN|EPOLLHUP, {u32=7, u64=17084159217947901959}}]
      1 1226010 04:02:26.1 execve("/bin/sh", ["sh", "-c", "/home/steamer/.local/share/Steam/ubuntu12_32/steam-runtime/amd64/usr/bin/steam-runtime-system-info
      1 1226011 04:02:26.2 execve("/home/steamer/.local/share/Steam/ubuntu12_32/steam-runtime/amd64/usr/bin/steam-runtime-system-info", ["/home/steamer/.local/share/Steam/ubuntu12_32/steam-runtime/amd64/usr/bin/steam-runtime-system-info
    371 1225828 04:02:28.3 [{EPOLLHUP, {u32=10, u64=8589934602}}]
      1 1225828 04:02:28.3 [{EPOLLIN|EPOLLHUP, {u32=10, u64=17084159217947901962}}]
    633 1225828 04:02:28.4 [{EPOLLHUP, {u32=10, u64=8589934602}}]
    419 1225828 04:02:28.4 [{EPOLLHUP, {u32=9, u64=8589934601}}]
    455 1225828 04:02:28.5 [{EPOLLHUP, {u32=10, u64=8589934602}}]
    111 1225828 04:02:28.5 [{EPOLLHUP, {u32=8, u64=8589934600}}]
    456 1225828 04:02:28.5 [{EPOLLHUP, {u32=9, u64=8589934601}}]
    338 1225828 04:02:28.6 [{EPOLLHUP, {u32=10, u64=8589934602}}]
    338 1225828 04:02:28.6 [{EPOLLHUP, {u32=8, u64=8589934600}}]
    338 1225828 04:02:28.6 [{EPOLLHUP, {u32=9, u64=8589934601}}]
    321 1225828 04:02:28.7 [{EPOLLHUP, {u32=10, u64=8589934602}}]
    320 1225828 04:02:28.7 [{EPOLLHUP, {u32=8, u64=8589934600}}]
    320 1225828 04:02:28.7 [{EPOLLHUP, {u32=9, u64=8589934601}}]
    351 1225828 04:02:28.8 [{EPOLLHUP, {u32=10, u64=8589934602}}]
    352 1225828 04:02:28.8 [{EPOLLHUP, {u32=8, u64=8589934600}}]
    351 1225828 04:02:28.8 [{EPOLLHUP, {u32=9, u64=8589934601}}]
    340 1225828 04:02:28.9 [{EPOLLHUP, {u32=10, u64=8589934602}}]
    340 1225828 04:02:28.9 [{EPOLLHUP, {u32=8, u64=8589934600}}]
    340 1225828 04:02:28.9 [{EPOLLHUP, {u32=9, u64=8589934601}}]
    376 1225828 04:02:29.0 [{EPOLLHUP, {u32=10, u64=8589934602}}]
    375 1225828 04:02:29.0 [{EPOLLHUP, {u32=8, u64=8589934600}}]
    376 1225828 04:02:29.0 [{EPOLLHUP, {u32=9, u64=8589934601}}]
    351 1225828 04:02:29.1 [{EPOLLHUP, {u32=10, u64=8589934602}}]
    352 1225828 04:02:29.1 [{EPOLLHUP, {u32=8, u64=8589934600}}]
    351 1225828 04:02:29.1 [{EPOLLHUP, {u32=9, u64=8589934601}}]
    430 1225828 04:02:29.2 [{EPOLLHUP, {u32=10, u64=8589934602}}]
    429 1225828 04:02:29.2 [{EPOLLHUP, {u32=8, u64=8589934600}}]
    430 1225828 04:02:29.2 [{EPOLLHUP, {u32=9, u64=8589934601}}]
Note: that I limited the above sampling to first 10000 lines of the trace as my intended check of this behavior with this command is difference and relation to when the system info checking starts, it is just more of the same repeating behavior untill all the sysinfo checks complete; the file is very large as that one was a full trace from the parent downwards; including sensitive bits, etc. Also it was sorted by thread-id and then the rest of the string, to compact it and get counts for each thread around a given time sample, so the above ordering is not exact. I'm aware that 'EPOLLHUP' is not always returned in flags of all epoll event notifications, but the above is just to try and identify the change in behavior and that it is a significant difference at that time of high cpu usage (and main cause of it per the perf data). Note the repeating set of epoll_data values seen above over that time.
I have some samples extracted from around the beginning of issue and the exiting of the system information checking threads, and some messy notes about where the sockets started, or epoll's setup when trying to figure out what they were related to originally for the returned epoll_data/original-fd-associated-with-union-values and such. The perf data has symbols I'm not privy to the details of, but maybe those could be correlated. New data could be taken later if I'm still able to reproduce the cpu usage side behavior (unless the new changes to workaround/solve the issue prevent me from delaying it for at least 10 seconds so that it's more obviously seen or triggered). I assume I'll need to reproduce it on Ubuntu to make testing easiest as that is likely what most are using for testing, if I'm still able to reproduce the high cpu usage side once the update with the patches for this specific timeout behavior quirk comes out.
Thanks again for your time and work to resolve the issues with timeout on the affected debian/other based distros.
Jan 23 or newer version of the Steam beta client has the needed runtime updates.
@kenshiros in the process of investigating and fixing the problems with srt-info, we have not encountered a situation where threads in the steam client went into busy loops or high CPU consumption.
However I've observed threads in the steam client doing a lot of work on the CPU on unrelated occasions. In one such instance it was crawling the depot of a game with ~ 40k or more files to build the music library. There are reports that depot updates consume a lot of CPU. Some of these will be expected behavior, some may not.
If after these fixes you can reproduce a situation where a steam thread spends a reasonably long time doing high CPU work, and you can't relate that to normal steam client activities, please make a separate report.
Since the Jan 23rd update of the runtime, it seems I'm no longer able to reproduce the high cpu usage on Fedora (with artificial delay in the wrapper script). So overall that looks great. (I tried to reproduce it many times using my previous method and varied the delays some just to be sure. I had done none of the recent OS side updates since starting to reproduce the issue, so on the software version side that is the only thing that has changed, which resolved the behavior.)
@TTimo Thanks for confirming, regarding not seeing the high cpu usage in testing.
Regarding the past correlation - (by observation only) it was directly related to starting the srt-info from the client's menu. It never occurred for me unless I started the System Information dialog, even if I waited a few minutes, 10 minutes, or launched it right away; and it would always start right away or in a few rare cases a bit delayed but no more than 20 seconds after opening the dialog. And only stopped being high after the srt-info completed. (Maybe it is in some initialization/etc spawned at that time.) There were a few times it seemed to not occur, though after trying the same process again it would continue to occur repeatedly (for each quit/start cycle test of the client). I normally tested by closing any open Friends chat windows and then going to the main News page to get away from anything that might be too active and to reduce the activity while gathering data, usually I waited at least 20 seconds or more (or for any current cpu activity to subside a bit after navigating to the News page; or for initial online status checks). Though, as noted even if I waited 10+ minutes it would still trigger upon launching the dialog and never before.
Unfortunately, as was noted I could not confirm for certain if it was interaction with the IOCP thread from something completely separate; only that the cpu usage usually started a few seconds after starting the dialog (and never without opening it in my case) and that it was always the IOCP thread and it was caused by the polling in the traces/perf(I have callgraph stacks with some missing symbol values in steamclient.so/IOCP_Thread, but only from an older client binary version). In the past it was reproduced on the Mint virtual machine with no games installed, and similarly for a fresh local user account on Fedora (no access to shared local content), though many times my testing was with my normal user account on this test system (so it does at least have many games it could be checking on). The disk is also a slow Western Digital green drive (in case this ever comes up and that is somehow related, though all the EPOLLHUP coming back repeatedly seemed to all be associated with sockets and not local files).
However, I'm no longer able to trigger the issue even though the intentionally sleeping timeout wrapper script would indeed stay running and was not being killed early by anything (which is expected/desired behavior if it was taking that long but completing successfully). I'm unsure how much was changed and if anything in initialization of the runtime by the System Information could be related, but indeed it no longer occurs for my past reproducer steps. While I couldn't guess why it's now ok, I'd say from my side this has resolved the issue (ones reproduced on Fedora artificially). I did not test on the Mint VM again, but suspect it was tested and seen as ok even with the older timeout build with the previously mentioned missing patches. I'll keep the strace/perf data and graphs around in case it ever comes up again and I happen to see any activity here that suggests they may be needed for comparison.
So the update definitely resolves the behavior I could reproduce, at the least. Thanks again!
As a short status update, I tested with my original Mint 19.2 VM (was mostly updated before Mint 19.3 came out a few days after); and can see that the srt-info processes all finished in reasonable time (did not hang the 10+ seconds send just prior to doing all the steam client updates); and similar to with the artificially induced Fedora scenario, I did not see the high cpu usage. I did not test Mint this time as much as I had with Fedora, but indeed the timeout quirk has been avoided.
That said, I set the Mint system up with the sole purpose of testing for these issues, so it may be good for others to check and confirm for their scenarios (after being sure the Steam Runtime and Client are fully updated); however, with what was probably seen in smoke testing during dev, I think it ok to say that behavior is resolved at the least on Mint and likely the other debian based ones with the missing timeout patches. I'm unsure if user verification (testing) is enough but figured I would do that while I had the chance with Mint 19.2.
Closing as fixed in the 2020-02-12 Steam client update.
Same problem there, one CPU core are at 100% usage, when steam client is running.
Ubuntu budgie 20.04
I also still have one core at 100% when steam is running
I'm on Manjaro
Although the issue isn't solved with killall steamwebhelper and steam already has 100% cpu before I see Installing breakpad exception handler for appid(steam)/version(1608507519) in the terminal, so maybe it's a different issue.
I solve this, when i remove some games, Stardew Walley, Doom 2016, Borderlands 3. Proton 4.13, 5.13. Then i remove all files in .steam folder, and only left games folder, to reset all configurations and re-download all files for steam.
Then restart Steam and all are ok.
So, i start removing items on Steam, because i have another Distro installed on other HDD, and there Steam have noting installed and running fine.
This is a long thread, didn't check if this was already mentioned...
I don't have this issue (ubuntu 20.04) but had this issue a long while ago and solved it by removing the file: .local/share/steam/ubuntu12_32/steam-runtime/amd64/usr/bin/steam-runtime-system-info
(path may be different on your machine, search for the steam-runtime-system-info)
I checked and it is still missing on my system...
This is a long thread, didn't check if this was already mentioned...
I don't have this issue (ubuntu 20.04) but had this issue a long while ago and solved it by removing the file:
.local/share/steam/ubuntu12_32/steam-runtime/amd64/usr/bin/steam-runtime-system-info
(path may be different on your machine, search for thesteam-runtime-system-info)I checked and it is still missing on my system...
I used this solution, but does not helped me.
Related threads
- Final Fantasy 14protonopen same upstream bug
- Space Engineersprotonopen same upstream bug
- Warframeprotonopen same upstream bug
- Risk of Rain 2protonopen same upstream bug
- Battlefield 4™protonopen same upstream bug
- Proton 6.3-1 input stutteringprotonclosed same upstream bug
- Blood: Fresh Supplyprotonopen same upstream bug
- Steam high cpu load when exiting specific gamessteamopen same upstream bug
- Steam process goes into an infinite loop (100% CPU usage)steamclosed same upstream bug
Proton versions
proton 4.13x1 2021-01proton 4.11-10x2 2019-12
Upstream links
- ValveSoftware/Proton/issues/3316x2 2019-12
- ValveSoftware/steam-for-linux/issues/5493x2 2019-12
Your system information
Please describe your issue in as much detail as possible:
System information
High Cpu usage for steam client, one CPU stuck at 100%.
Steps for reproducing this issue:
htop screenshot:
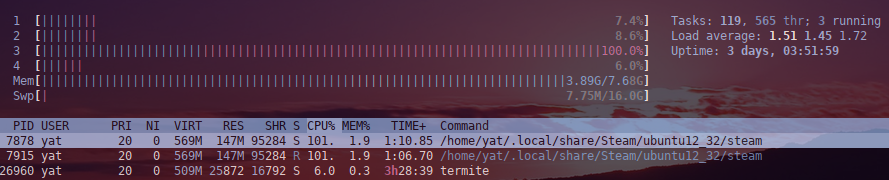
Tried launching steam-native in terminal, here is the full output.
I marked the line where the CPU start to have high usage, at the bottom.
The issue start when the line :
Installing breakpad exception handler for appid(steam)/version(1526683293)appear after the steam client open.